THE WORLD MAP UNIVERSE
The World Map or more over a planisphere, is an object that is part of our daily lives. To find your way around on a map and find your way back, to learn geography, to decorate or to travel and dream, the world map is versatile and can fulfil many roles. We probably remember the educational and colorful Maps of our childhood, with which we discovered geography, countries and their capitals.
Today, the World Map is a universal object. Indeed, who does not recognize the world with the characteristic shape of its continents and territories? Who does not locate his country, his city or the path of his old journeys in front of a planisphere? Who doesn’t dream of going here or there when you look at a World Map? The World Map is an object that speaks to everyone, regardless of their nationality or origin. Whatever his desires, passions or dreams.
But like any existing object, the World Map has its own history with its own twists and turns. She was born into the hands of several talented men, then evolved, and regressed to a new birth. It has sometimes been very different from the one we know today.
The Projections
From its vicissitudes, many different types of maps were born, each one as different from the other, but which come together around a common goal: to represent the world in the most realistic way possible.
Their History
The World Map has changed with historical events and the emergence of new knowledge. We invite you to discover its captivating odyssey from prehistory to the present day.
Did you know?
The World Map
Although the term World Map is now commonly used to refer to any world map today, it was originally used to refer to the maps of the imagined flat world made in Europe during the Middle Ages. All the real world maps (or mappa mundi) that we currently have represent a vision of the archaic world, with distances that are often false or imprecise. Today, 1,100 mappa mundi come from the Middle Ages.
The Wind Rose
The first Wind Roses did not point in four directions, but eight! The Wind Roses in the Middle Ages indicated the east at the top so that Jerusalem, the holy city, could be placed on a higher level.
PROJECTIONS
Some Cartography vocabulary
The Earth Globe is a template of the Earth, that is, a real and faithful 3D representation of our planet in reduced size.
The Planisphere, as its name suggests, is a map of the Earth’s Globe in flat projection, which distorts reality because representing the surface of a sphere flat is simply impossible. Especially since we must not forget that our planet is not completely spherical, but rather resembles an ellipsoid! As we have understood, by definition, a planisphere, or what is more commonly called a map, is false. The different types of maps that exist today have all been created with the aim of getting as close as possible to the complex geography of our planet.
Cartographic Projection: to make a Planisphere, that is a “transcription” of the Earth’s Globe on a flat surface, it is necessary to make what is called a cartographic projection. This consists in applying a mathematical formula to each point on our globe located by its latitude φ and longitude λ, which will provide it with a new location on a plane defined by its x-axis and y-axis. Mathematically, it looks like:
x = f1(φ, λ) and y = f2(φ, λ)
Let’s skip the math! Instead, let us look at the different cartographic projections that have marked the history of the World Map.
Terrestrial cartographic projections from the most classic to the most extravagant
Note : The following list of projections is not intended to be exhaustive. We have chosen to present the most remarkable and selected projections as different from each other as possible in order to reflect the diversity of the templates and the ingenuity of the men who created them. Almost all projections have variants or improvements that have their own names (there are more than 200!). We did not consider it appropriate to present them for the sake of clarity and readability for the reader, as our goal is not a highly technical presentation, but a pedagogical and pleasant introduction to cartographic projections.
Projections by Mercator, Gall-Peters and Mollweide
Let’s start with the most famous, and undoubtedly the most aesthetic, or at least the most common: the projection of Mercator, named after its inventor Gérard Mercator. It is a cylindrical projection that preserves the angles, hence its great utility for navigators who could easily draw their course lines when they were at sea. Such a stress on the angles, however practical it may be, causes a distortion of distances, and therefore of areas, and consequently of proportions between continents.
There are several variants of the Mercator projection, the differences are in the spacing of parallels. In fact, the most commonly seen World Maps today do not correspond exactly to Mercator’s, but rather to its variants that minimize the deformations of continents at the poles: we can cite the equirectangular projection of Marin de Tyr, the stereographic projection of Gall, and the cylindrical projection of Miller, for example. However, they have the same characteristic, which is to deform the relative surface areas.
Mercator
1569
Cylindrical
Compliant
It was to remedy the distortion of Mercator and its variants which, to cite one example, gave Africa a smaller size than reality, that James Gall, followed by Arno Peters, proposed their own cylindrical projection which preserved the relative surfaces: the Gall-Peters projection. This is a compromise because, on the contrary, it does not preserve the angles, which makes the continents deformed and therefore less aesthetic.
Gall-Peters
1855
Cylindrical
Equivalent
The Mollweide projection, also called Babinet projection, is another way of preserving relative surfaces by projecting, but always at the expense of angles. This well-known projection is frequently used for planispheres because of its compactness. It is described as pseudo cylindrical.
Mollweide
1805
Pseudo-Cylindrical
Equivalent
Note: To understand the qualifiers of the projections (cylindrical, conforming, equivalent, etc.), go a little further on this page, in the section The Classification of Cartographic Projections.
Earth globe
Mercator
Gall-Peters
Mollweide
The Goode projection
The pseudocylindrical Goode projection was proposed by John Paul Goode as an alternative to the Mercator projection. Indeed, it is an ingenious cutting of the globe that may seem coarse at first sight by resembling a “peeled orange peel”, but which has the advantage of respecting the relative surfaces much more than the Mercator, just like the Gall-Peters.Goode
1923
Pseudo-Cylindrical
Equivalent
Goode projection
The Azimuthal Equidistant projection
The Azimuthal Equidistant projection projects each point of the globe in a circular manner on a plane with the North Pole as its centre, respecting the distances between the meridians. One of the known uses of this projection is found in the UN logo.
Postel
1580
Azimutal
Equidistant
Emblem of the United Nations
Azimuthal Equidistant projection
Cassini’s projection
Practically neglected today, Cassini’s projection is constructed in the same way as Mercator’s cylindrical projection, with the difference that it is transverse. This means that the globe was reversed by 90° during the projection operation. The result is that the equator of the Mercator cylindrical takes the place of the central meridian in the Cassini and vice versa. In a nutshell, it looks like this:Cassini
1745
Cylindrical
Compliant
Comparison between Mercator and Cassini
The Cassini is commonly presented in this way
Albers’ projection
Albers’ projection is defined as conical. As well as several other previous projections, it has the strength to conserve relative areas. Currently, it is the official projection in 2 western Canadian provinces: British Columbia and Yukon.Albers
1805
Conical
Equivalent
Albers Projection
Projections by Bonne, Sanson-Flamsteed and Werner
Another existing projection consists in drawing the parallels of the globe as concentric and equidistant circles, along which the scale remains constant and is equal to that of a meridian of given origin. This is Bonne’s projection. Two parameters can vary: the famous prime meridian, which is placed in the center on the projection, and the original parallel whose radius of curvature is preserved. The borderline cases of these parameters provide particular projections of the Good and have their own names:
Sanson-Flamsteed projection: the original parallel is the equator.
Werner’s projection: the original parallel is a pole.
Good
1780
x
x
Bonne Projection
Prime meridian = 0° (Greenwich meridian), Prime parallel = 45°.
Sanson-Flamsteed Projection
Prime meridian = 0° (Greenwich meridian), Prime parallel = 0° (equator)
Werner Projection
Prime meridian = 0° (Greenwich meridian), Prime parallel = 90° (pole)
Fuller’s projection
Fuller’s projection, invented by Richard Buckminster Fuller in 1946, is based on an ingenious technique: we approximate an icosahedral earth, i. e. a 20-sided polyhedron. It is then easy to represent the earth on a flat surface by unfolding the icosahedron pattern. Thus, the relative surfaces and shapes of the continents are almost preserved. But it offers another advantage and not the least: having neither high nor low, it does not highlight any culture or country, unlike the classic and relatively well-known projections often centred on the West. Fuller’s projection also leaves freedoms such as a different division or orientation due to the absence of mapinal orientations.Fuller
1954
Azimuthal
x

The Authagraph projection
Finally, the Authagraph projection, recently invented by the Japanese architect Hajime Narukawa, is very similar to Fuller’s projection in its design, with the only difference that it uses a spherical surface of 96 faces instead of 20! The result is a quasi-equivalent cartographic projection, i.e. a map that is almost perfect in terms of relative proportion.Autagraph
1999
Azimuthal
x
The classification of cartographic projections
There are two main classifications of projections: the first according to the nature of their alterations, and the second according to their mode of construction.
Projections according to their modes of construction
By definition, the projection surface is a surface on which the globe is “unfolded” in order to “flatten”. Only three projection modes are presented here, the 3 main ones. It should be noted that there are others, more specific (elliptical, pseudo-cylindrical, sinusoidal, etc.).Azimuthal projections
The projection surface is flat and tangent to the projected sphere. The blue projection center is the tangent point.
Meridians are concurrent lines. Parallels are concentric circles, equidistant or not.
Cylindrical projections
The projection surface corresponds to a cylinder tangent to the projected sphere. The blue projection center corresponds to a circle.
Meridians and parallels are perpendicular lines to each other. The parallels are equidistant or not.
Conical projections
The projection surface is a cone. The blue projection center is a circle.
Meridians are concurrent lines. Parallels are concentric circles, equidistant or not.
Note: The further away from the projection centre, the more noticeable the deformations due to the projection mode are.
Projections according to the nature of the geographical alterations
The three main classes are presented here. There are other more specific ones (equidistant for example).
Equivalent projections
They preserve the surfaces. The alterations are made on the corners, and therefore the continents as we move away from the projection centre.
Conformal projections
They preserve the angles. In other words, the parallels and meridians intersect at right angles, exactly sum on the globe. Alterations are made to distances and surfaces as one moves further away from the projection centre.
Aphylactic or any other projections
They do not retain any corners or surfaces. These projections attempt at best to find a compromise between the different alterations.
The nature of the alterations can be clearly identified using Tissot’s indicators. They consist in transcribing on the projection the deformed shapes of a series of circles that are identical on the globe.
Conformal projection
The shape of the circles is not deformed, unlike their surface area.
Equivalent projection
The surface area of the circles is not deformed, unlike their shape.
Aphylactic projection
The shape of the circles and their surface area are distorted.
In Summary
Projections can be classified either by the types of alterations they produce or by their construction method.
There are 3 main classes of projections in terms of alterations: conform, equivalent and aphylactic.
There are 3 main classes of projection mode: cylindrical, azimuthal and conical.
The most common projection nowadays is the Mercator one, it is a conformal cylindrical projection.
THEIR HISTORY
The emergence of the Map concept in Prehistory
Much better known than its famous rock boards, the Lascaux Cave also shelters part of the night sky on its walls dating back to 16,500 BC. The 3 brightest stars and the Pleiades, a cluster of stars, appear in particular. If it is the sky and not the surrounding world, this is a first form of mapping.
However, the very first map shape in the world is considered to be an engraved rock of several tens of square metres in Italy. It is the Map of Bedolina whose realization is located between Prehistory and Antiquity. It presents several topographical data such as villages, fields, roads, etc. The extent of the “world” presented on this map is of course very limited, but it is nevertheless a map of the known world around it at the time.
The birth of true knowledge in Ancient Times
Ptolemy and the Greeks: representing the world in a realistic way
The Greek world is a pioneer in the field of maps: Ptolemy, probably the most famous mathematician and astronomer, made great strides in the science of cartography, while at the same time helping himself and drawing inspiration from the knowledge of the scientists who preceded him: Eratosthenes, Marin de Tyr, Hipparchus, Hecatée de Milet, etc.
In 150, he produced his work The Geography, a compilation of knowledge of the world and its geography. The 8th and last book of this book is what could be called the first regional atlas of the ancient world composed of 27 maps, the first being a main and general map of the Mediterranean accompanied by several more localized secondary maps with more details. The 1st book is theoretical and presents the basics of the subject. The following six books are collections of more or less exact geographical coordinates of countless places known at the time (cities, mountains, etc.).
The sphericity of the Earth being known in the ancient Greek world, Ptolemy was the first to introduce what is called cartographic projection. He created the first planisphere using a conical projection, but which nevertheless significantly distorted the territories due to the inaccuracy of the coordinates of the time. His regional maps use a cylindrical projection, inspired by Marin de Tyr.
If all Ptolemy’s maps have been lost, this is not the case with his collections of coordinates or his theoretical writings of the 1st book of his Geography, which allowed him to easily redraw his achievements later.
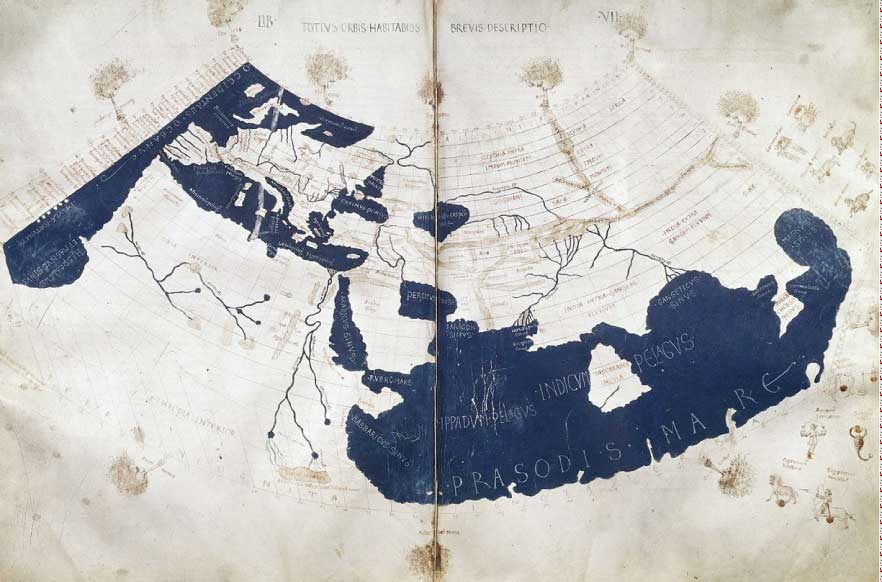
Ptolemy map in conical projection later redrawn during the Middle Ages.
Romans: maps to facilitate circulation
The Romans had developed maps of all the main roads and cities of the Roman Empire, stretching from Great Britain to present-day Turkey, these are the ancestors of the road map. There is only one copy left today from the 13th century: The Peutinger map. The Peutinger map is a 7m long and 34cm wide roll, on which a whole series of itineraries are inscribed, each independent of the other and without any particular coordinate system. Thus, for the Romans, the priority of the maps was to find their way around and therefore to circulate easily in their vast empire, and not a desire to represent the world as accurately as possible.
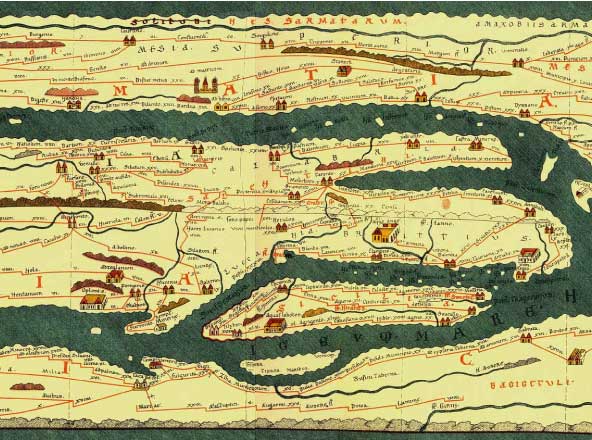
Piece from an 1887 facsimile (exact reproduction) of the original Peutinger map. There is an obvious lack of realism and the bright red roads that criss-crossed the Roman Empire.
From the Middle Ages to the Great Discoveries and beyond
The Arab world and the Tabula Rogeriana world map
During the medieval period and unlike the West, the Arab world fully retains the knowledge of Ptolemy, and makes many improvements. King Roger II of Sicily had the Arab geographer Al-Idrissi work with him, who allowed the birth of the world map Tabula Rogeriana in 1154, wanted realistic. This World Map is oriented to the south and the north east at the bottom, only part of Africa and the Eurasian continent are represented, and they are accompanied by a text explaining the characteristics of each delimited region: cultural, political and socio-economic conditions. This information was collected over 15 years by Al-Idrissi from experienced travellers and from books he had at his disposal.
T-Maps or TO-Maps
The geography of Ptolemy, mainly lost in Western Europe, is the T-Maps (or TO) which were mainly present in the Middle Ages between the 7th and 13th centuries. They are composed of 3 parts separated by the lines of a T, in the centre is Jerusalem, considered as the centre of the world, and the 3 parts correspond to the only continents known at the time: Europe, Asia and Africa. Asia is oriented to the north, Europe to the southwest and Africa to the southeast. The whole is surrounded by an O representing the ocean, hence the name of this Map. It is understandable that with a representation such as this one, extremely far from reality, these world maps were not designed to locate or move. They were above all a representation of the world reflecting the philosophical ideas and religious context of the time.
The Ebstorf Map, designed in the mid-12th century, is the most complete T map known to date. The Hereford Map of 1290 is another known example.
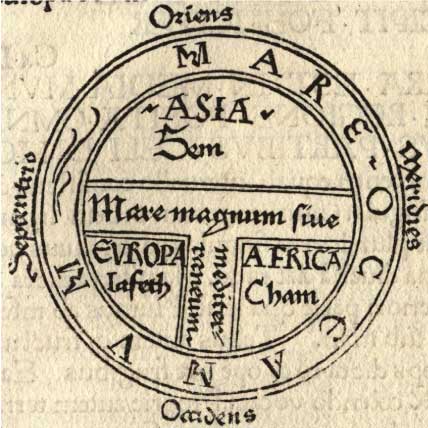
TO map of the 7th century
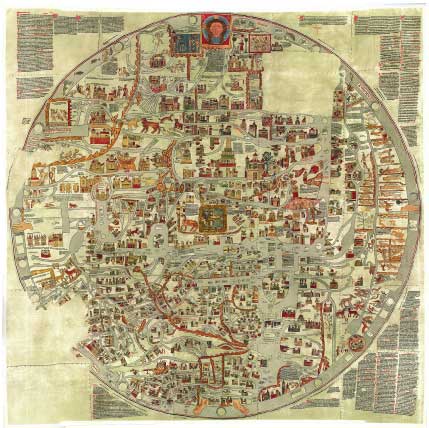
TO map of Ebstorf. The T is less prominent, but well present in the lower right part, it is formed by the sea.
The Portulan
Faced with the theological nature of T-maps, and with the practical and growing experience of navigators, the Portulan appeared in the 13th century. Navigation map used until the 18th century. It is mainly designed to identify ports, coasts, islands, and all the dangers associated with them: currents, shoals, etc., and thus facilitate navigation at the time. It is characterized in particular by its intertwining of color lines, which could be likened to “cobwebs”, and which are built from 16 mapinal directions spaced at 11.25° called Rhumb lines. There are no geographical coordinates. The continents, on the other hand, often remain untouched or are richly decorated without any use, which makes the portulans maps exclusively for marine use.
Among the first portulans were the Pisan Map dated 1290, that of the genoa Petrus Vesconte around 1310, and that of Angelino Dulcert in 1339. Another portulan dating from 1375 and considered to be the masterpiece of cartography of this century is the Catalan Atlas. Produced by Abraham Cresques around 1375, it contains characteristics related to astrology and cosmography, it includes the three continents known at the time, including Asia, where mythological elements appear.
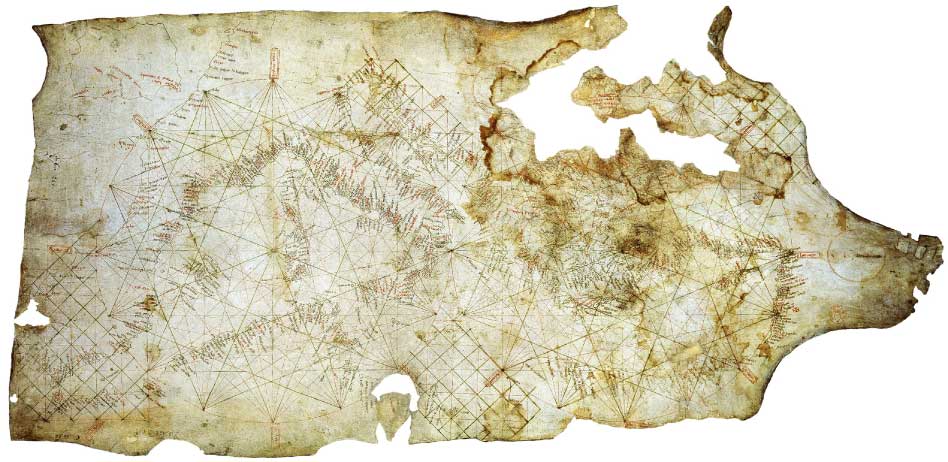
The Pisan Map in 1290, with all the names of the ports that show the shape of the coasts, as well as the famous spider web Rhumb lines. We can clearly distinguish the characteristic shape of the Mediterranean.
Many of these maps were considered art because they reflected a deep knowledge of the seas and were witnesses to the commercial and naval power of a kingdom. Indeed, if the first portulans mainly represented the Mediterranean region and the Black Sea, they widened with time to include all the space explored by the navigators of the time.
It is the Portuguese who are the first to develop a strong cartographic activity thanks to the portulans. The realization of the first portulans of the African coasts with the Portuguese Vasco de Gama who circumvent them for the first time, are all the more necessary as the stars in the southern hemisphere are no longer the same as those in the northern hemisphere. The night sky was indeed one of the means used by explorers to find their way. The most accurate map of unknown lands becomes a treasure, and even a state secret for the kingdoms that owned it, notably Portugal.
The Geography of Ptolemy found
Nevertheless, the secret is poorly kept and these maps with precious information are spreading. The printing press, moreover, plays a major role in this diffusion. In the meantime, the Geography of Ptolemy, which was well known in the Arab-Muslim civilization, arrived in Italy in the 14th and 15th centuries, then very quickly in France, where it was also widely distributed. His maps are redesigned, his texts are translated. The Geography of Ptolemy became one of the most printed books along with the Bible. Embellished with its improvements and extensions since its creation, it became the basis for all maps until the 16th century, simultaneously with the change in world view brought about by the Great Discoveries. Geographical coordinates are entered. The Portulan technique and the geography of Ptolemy complement each other and enrich the science of cartography.
The ”fourth continent”, America, became known with the advance of the Great Discoveries. The first maps of this continent emerged at the beginning of the 16th century. The maps are becoming more and more realistic. With the possibility of representing the world in its entirety, the need to use cartographic projections is growing, hence the emergence of many of them. Cartographer then became synonymous with mathematician in the 16th and 17th centuries. One of the most famous, Mercator, is at the origin of the cartographic projection, probably the most widely used today. In 1569, he created a conformal cylindrical projection that was very advantageous for navigation. Mercator’s projection was an immediate success, the end of Ptolemy’s geography. The strong development of cartography has given rise to specialized schools in this field.
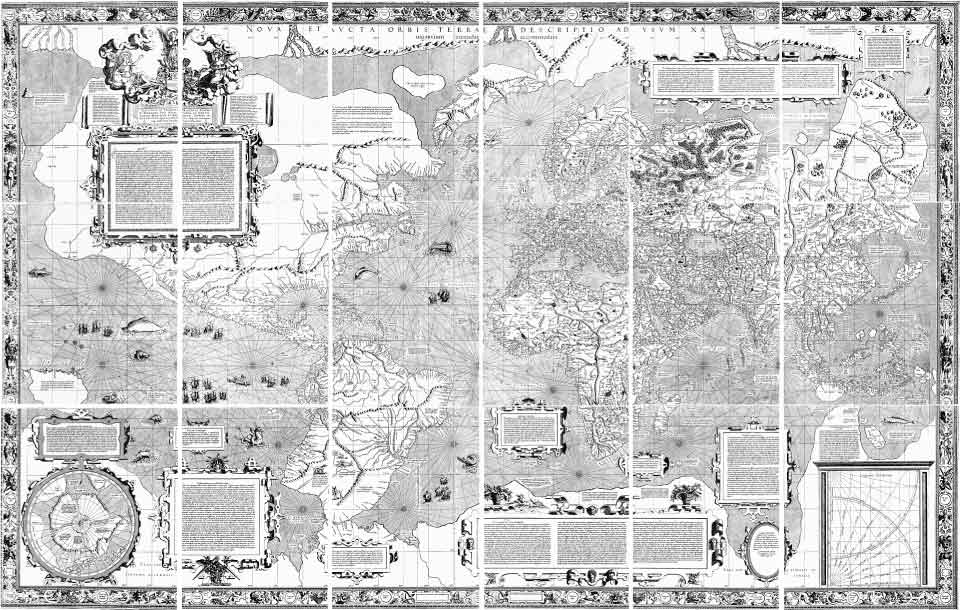
The original Mercator projection from 1569. We find the Rhumb lines that characterize the portulans.
The maps are now free of all religious or mythical references strongly present in medieval times.
The atlases, collections of maps, took off in the 16th century. Very decorated, illustrated and luxurious, they are only accessible to the very wealthy. Owning an atlas was a sign of social distinction and recognition. In the 17th century, neat maps became objects of art and were exhibited like boards.
As the centuries pass, the discovery of unknown lands gradually comes to an end, the evolution of the World Map slows down, while continuing to improve in its details. Cartographic projections continue to emerge over time, always trying to recreate the world as much as possible with as little distortion as possible.